
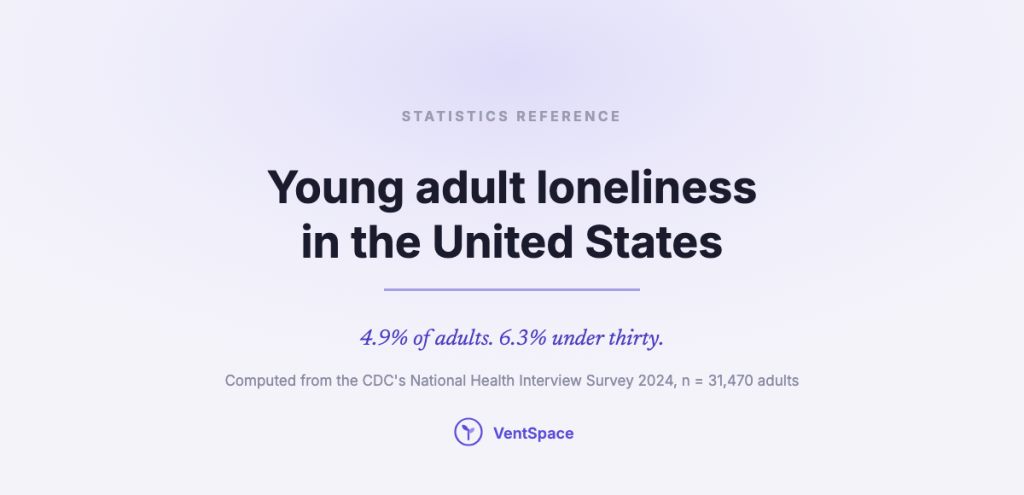
If you came here for one number, here it is, and it is smaller than the one you were expecting.
In 2024, 4.9 percent of American adults say they feel lonely always or usually. Another 18.8 percent feel it sometimes. Half say never. That is the United States government’s own measurement, taken from 31,470 adults, and we computed it ourselves from the raw file because nobody else seems to have put the age bands in one place.
Among adults under thirty the figure is 6.3 percent, which is the highest of any adult age group in the country. That is the part worth sitting up for, and it is also the part that gets oversold the moment it leaves the survey.
The short version
– The US government asks one question: how often do you feel lonely. In 2024 it got 4.9% always or usually, 23.7% at least sometimes, 50.6% never.
– Under-30s are the loneliest adult age band at 6.3%, against 4.0% at 65 and over. The gap is real and statistically solid.
– By the 25 to 30 band the gap against middle age has closed to inside the margin of error. The effect is concentrated in the youngest adults.
– The firmest age finding is not about frequent loneliness at all. Under-30s are 9.4 points less likely to say they never feel lonely.
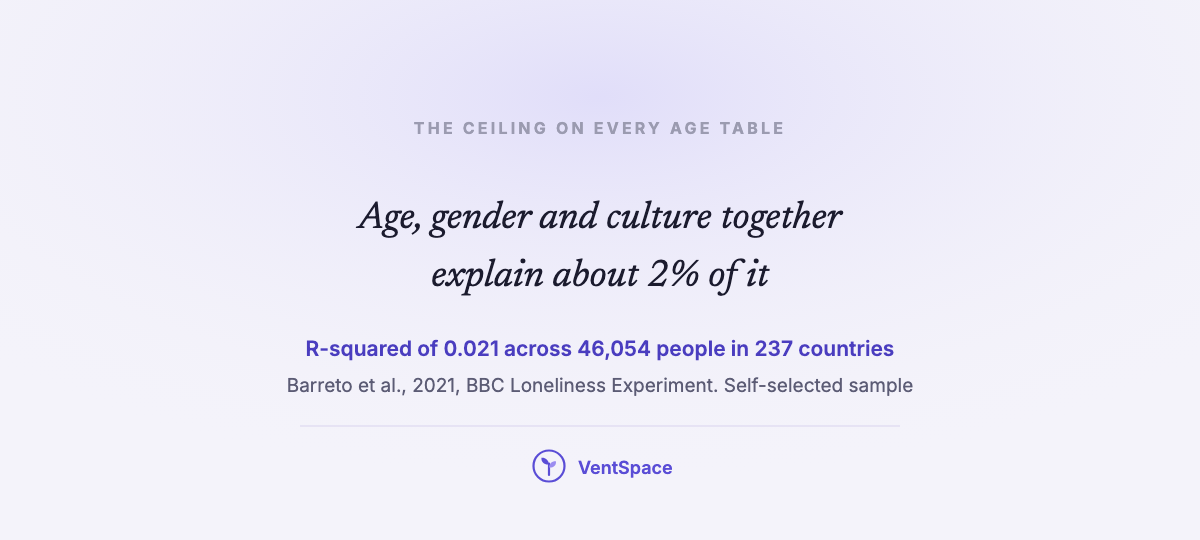
– Age, gender and culture together explain about 2 percent of who feels lonely. Almost everything is something else.
– Popular figures of 40 percent and more are not necessarily wrong. They come from different instruments, and this page shows how they differ.
If you need help right now
If you are in crisis or thinking about harming yourself, please reach out now. In the United States you can call or text 988 for the Suicide and Crisis Lifeline. Outside the US, findahelpline.com will give you the number where you are. A statistics page is not a substitute for that, and we would rather you closed this tab.
What does the United States measure?
It measures one sentence, asked of a random sample of the country. The National Health Interview Survey, run by the National Center for Health Statistics, puts it this way:
“How often do you feel lonely? Would you say always, usually, sometimes, rarely, or never?”
That item arrived in January 2024, in the survey’s Phase 4.0 content, sponsored by the CDC’s chronic disease centre. It is not the only federal question on loneliness. The CDC’s state-based Behavioral Risk Factor Surveillance System also carries one, and its 2022 wording was later changed because it could be read as measuring isolation rather than loneliness.
Two things follow from the wording, and both matter more than the headline.
It measures frequency, not intensity. A person who is devastated once a month and a person mildly adrift every afternoon are not separated by this question. And it is a single item, not a scale, which makes it modest, legible and hard to inflate.
Here is the whole distribution:
| How often do you feel lonely? | Share of US adults | 95% confidence interval |
|---|---|---|
| Always | 2.5% | 2.25–2.71 |
| Usually | 2.4% | 2.20–2.61 |
| Sometimes | 18.8% | 18.30–19.36 |
| Rarely | 25.7% | 25.06–26.40 |
| Never | 50.6% | 49.75–51.35 |
Frequent loneliness in the research literature means the top two rows added together. That is where 4.9 percent comes from, and about 12 million adults with it.
How we know the arithmetic is sound. We downloaded the 2024 Sample Adult public-use file from the CDC, applied the survey’s own annual weights, and used its own stratum and cluster variables to get the intervals. Two independent teams have since analysed the same file in preprints, Sikder, and Dildine, Burke and Kapos. Neither is peer reviewed, and our overall figures reproduce both to the decimal. That is the check that licenses the figures further down, which we have not seen published elsewhere.
Quick Summary
Q: Does the US government measure loneliness?
A: Yes. Since January 2024 the National Health Interview Survey has asked “how often do you feel lonely” with five options, and in 2024 it found 4.9% of adults answering always or usually and 23.7% answering at least sometimes.
Are young adults really lonelier?
Yes, and the honest version of that sentence is more interesting than the headline version. Under-30s are the loneliest adult band in the country on all three ways of cutting the question. The size of it is modest, and the shape of it is not what the genre implies.
| Age band | Lonely always or usually | 95% CI | Respondents |
|---|---|---|---|
| 18 to 29 | 6.3% | 5.39–7.19 | 3,951 |
| 30 to 39 | 4.9% | 4.18–5.53 | 5,077 |
| 40 to 49 | 4.4% | 3.76–5.13 | 4,362 |
| 50 to 64 | 4.9% | 4.29–5.46 | 7,488 |
| 65 and over | 4.0% | 3.57–4.44 | 10,592 |
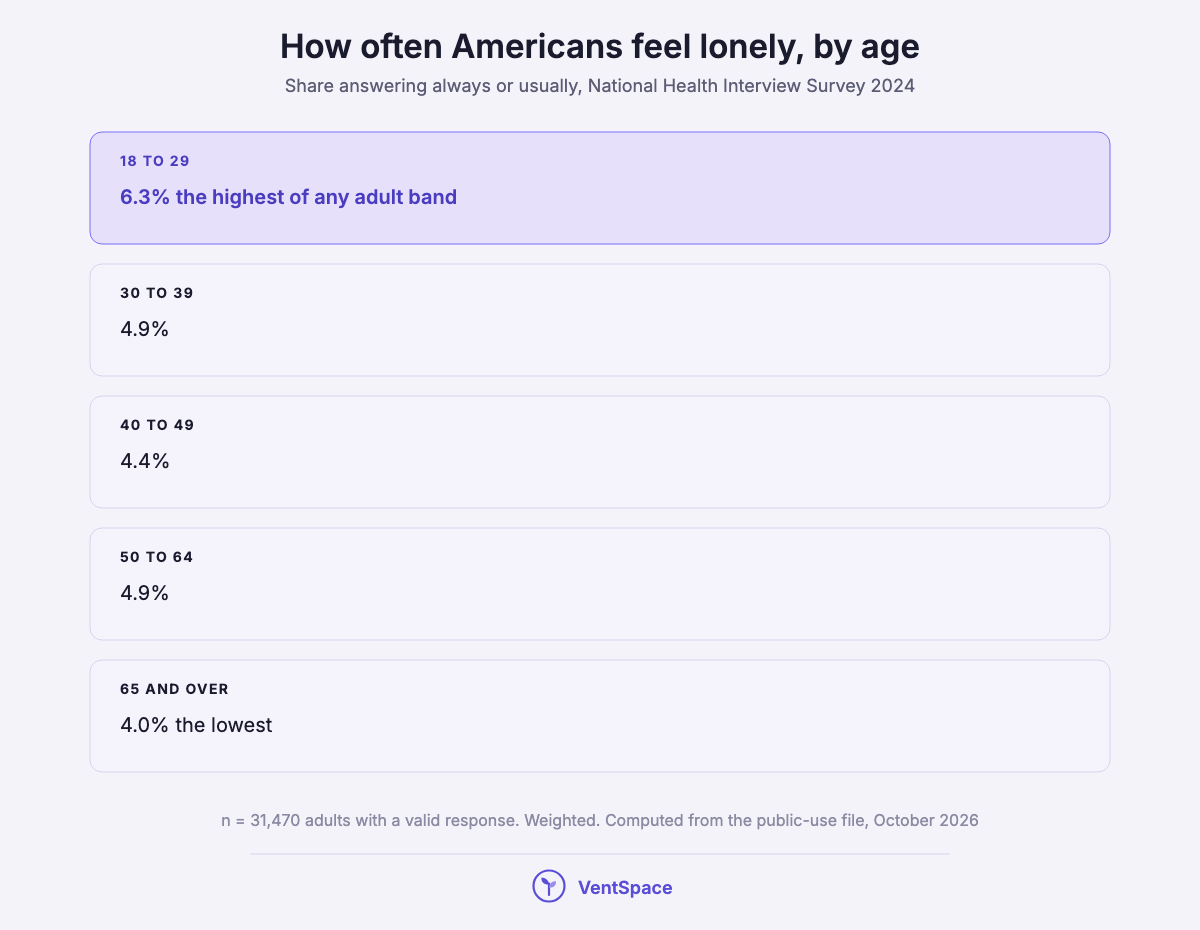
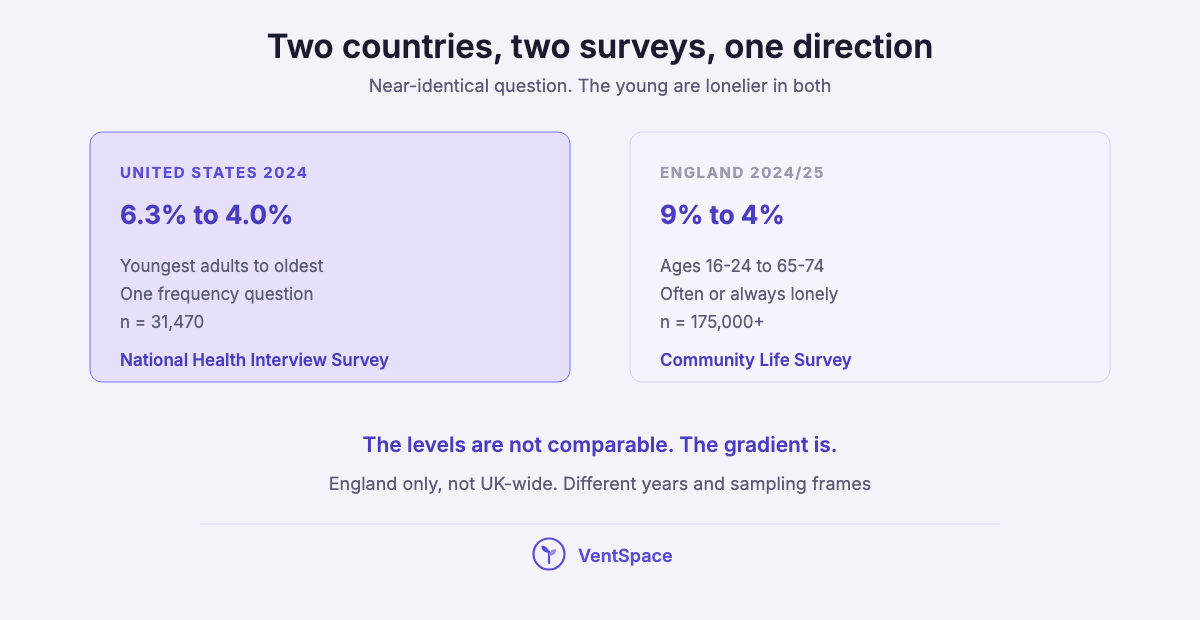
Against every adult aged thirty or more, the under-30s run 1.8 points higher, and the difference clears significance comfortably. So the cultural picture of loneliness as something that waits for us at the far end of life is, on the American evidence, upside down. England’s own national survey, which asks a near-identical question of more than 175,000 people, finds the same ordering: 9 percent at 16 to 24, falling to 4 percent at 65 to 74. Two countries, two sampling frames, one direction.
Now the part that complicates the headline, and we would rather print it than bury it.
| Finer cut | Lonely always or usually | 95% CI |
|---|---|---|
| 18 to 24 | 6.6% | 5.35–7.90 |
| 25 to 30 | 5.8% | 4.77–6.86 |
| 25 to 34 | 5.5% | 4.70–6.24 |
| 31 to 40 | 4.7% | 4.04–5.35 |
By the 25 to 30 band, the gap against the 50 to 64 band has closed to inside the margin of error. The difference is 0.9 points, and it does not reach significance. The 30s are indistinguishable from the 50s and early 60s. Whatever is happening to young adults is happening most sharply to the youngest of them. This is one year of data from one survey, so it shows a smaller gap in the late twenties than in the early twenties, not what happens to any one person as they age.
And the firmest finding in the whole file is about the other end of the scale. Not about how many young adults are frequently lonely, but about how many are never lonely at all:
| Age band | Lonely at least sometimes | Never lonely |
|---|---|---|
| 18 to 29 | 29.1% | 43.0% |
| 30 to 39 | 23.7% | 49.3% |
| 40 to 49 | 21.6% | 53.5% |
| 50 to 64 | 21.5% | 53.7% |
| 65 and over | 22.9% | 52.8% |
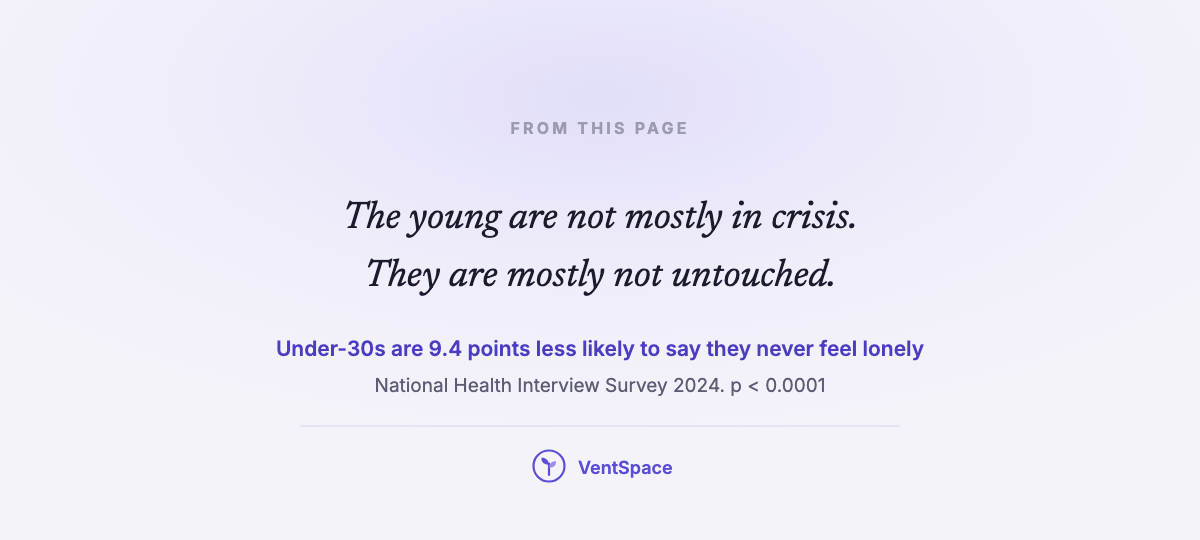
Under-30s are 9.4 points less likely than everyone older to say they never feel lonely, and that difference is the most statistically secure age result here. The young are not mostly in crisis. They are mostly not untouched, which is a different and more ordinary claim, and it is the one the data can carry.
Quick Summary
Q: Are young adults lonelier than older adults?
A: Yes. In the 2024 National Health Interview Survey, 6.3% of US adults aged 18 to 29 felt lonely always or usually, against 4.0% of adults 65 and over. The gap is largest in the 18 to 24 group and closes to statistical insignificance by the late twenties.
Insight The reason this page leads with a small number rather than a frightening one is that the small number is the one that survives being checked. A single frequency question, asked of a properly drawn sample of 31,470 people, is a less exciting instrument than a twenty-item scale with a threshold. It is also much harder to argue with.
What your age does not explain
Here is the figure that should sit beside every demographic table ever published on this subject, including ours.
In the largest study to put age, gender and culture into one model, those three things together accounted for about 2 percent of the variation in who feels lonely. The research was the BBC Loneliness Experiment, 46,054 people across 237 countries and territories. Age pointed the way our table points, downward with the years. Gender and national culture added their small push. And when the authors totalled what all of it explained, they reached an R-squared of 0.021.
We should be careful with this in both directions. The sample was self-selected through a broadcast, which is about as unrepresentative as a sample of that size can be, and it is one dataset. But the direction of the point is not fragile, and it is the most useful thing on this page. The age gradient is a fact about a population. It is close to useless as an account of a person.
Which means the sentence a reader might reasonably assemble from the tables above, that they feel this way because they are twenty-seven, is not supported by the thing that produced the tables. Two people of the same age, the same gender and the same country sit on opposite ends of this measure all the time. Whatever explains the other 98 percent is particular to a life, and no survey has ever been able to see it.
Quick Summary
Q: Does being young explain why someone feels lonely?
A: Barely. In a study of 46,054 people, age, gender and culture together explained about 2% of the variation in loneliness. The age difference between groups is real, and it says almost nothing about any individual.
Men and women
On the federal measure, we cannot distinguish them. Men come out at 4.7 percent and women at 5.1 percent, and the confidence intervals overlap. Among under-30s it is 6.1 percent of men and 6.6 percent of women, overlapping again.
That sits awkwardly beside the figures the rest of the internet uses, so here they are together:
| Source | What it found | Instrument |
|---|---|---|
| National Health Interview Survey 2024 | Men 4.7%, women 5.1%. No significant difference | One frequency item, five options, n = 31,470 |
| AARP, August 2025 | 40% of adults 45+ lonely. Men 42%, women 37% | Scale not named on the report page. n = 3,276, adults 45 and over |
| Gallup World Poll, 2023–24 data | 25% of young men aged 15 to 34, against 17% of all other adults | Previous-day loneliness item |
Three instruments, three answers. We do not think one of them is lying. A previous-day question, an over-45 survey whose measure is not described, and a five-point frequency item are measuring three different things, and the male gap appears in two of them and not in the third. The responsible summary is that the question of whether American men are lonelier than American women is not settled by the data we can see, and a page that picked the most quotable of the three would be making a choice and calling it a finding.
Quick Summary
Q: Are men lonelier than women?
A: It depends on the instrument. The 2024 National Health Interview Survey finds no significant difference between men and women. AARP’s 2025 survey of adults 45 and over, and Gallup’s previous-day measure, both find higher rates among men.
Why do some sources say half of Americans are lonely?
Because they are using a different instrument, and the instrument is doing most of the work. This is the single most useful thing to understand about loneliness statistics, and it takes one table.
| Measurement | What it asks | Where it cuts | Result |
|---|---|---|---|
| National Health Interview Survey, 2024 | How often do you feel lonely | Always or usually | 4.9%, or 23.7% including sometimes |
| Community Life Survey, England, 2024/25 | How often you feel lonely, five options | Often or always | 7% of adults. 9% at 16 to 24 |
| Gallup World Poll, 2023–24 data | A previous-day loneliness item | Yesterday | 25% of men aged 15 to 34, against 17% of all other adults |
| AARP, fielded August 2025 | Not described on the report page | Not described | 40% of adults 45 and over |
Read down the “where it cuts” column and the mystery dissolves. A single question cut at “usually” classifies about one person in twenty. A question about yesterday, a lower cut such as “often”, or a measure whose cut is not described at all, will classify a different and often much larger share. Multi-item scales with a threshold, such as the UCLA Loneliness Scale behind some widely quoted figures, depend entirely on where that threshold sits. Neither number is wrong, and they are not answers to the same question.
Two further things we think a reader should have.
The generational figures from the Cigna loneliness index could not be checked. The percentages for the youngest age groups circulate everywhere, usually in the high sixties or seventies. We tried to open the underlying reports and both PDFs are images with no extractable text, so we cannot confirm what is in them. They are not printed here.
The most-repeated health comparison in this subject has no paper behind it that we could find. We are not going to reproduce the sentence, because reproducing a false claim is how it travels, and because this house keeps a standing rule against printing it. It concerns mortality, it is usually attributed to research in general, and multiple attempts to trace it to a study have failed here. If you see it, treat it as a slogan.
Quick Summary
Q: Why do loneliness statistics disagree so much?
A: Because the instruments differ. A single frequency question cut at “always or usually” gives about 5% of US adults. A previous-day question in Gallup’s World Poll gives 25% of men aged 15 to 34. AARP’s survey of adults 45 and over, on a measure its report page does not name, gives 40%. The spread is measurement, not disagreement about reality.
Having people, and being lonely anyway
There is a sentence people arrive at this subject carrying, and it is not a paradox even though it feels like one. I have people. I still feel completely alone.
The official definition is on our side here. The Surgeon General’s 2023 advisory defines loneliness as “a subjective distressing experience that results from perceived isolation or inadequate meaningful connections”, where inadequate means the discrepancy or unmet need between a person’s preferred and actual experience. A discrepancy, not a quantity. Which is why having a full contact list and a hollow Tuesday are not in contradiction.
The numbers point the same way. In that same English survey of 175,000 people, 95 percent said there is at least one person they could really count on to listen if they needed to talk. Whatever loneliness is for most people, a shortage of available humans does not look like the main ingredient. We cannot tell you how those two groups overlap, because the survey does not cross-tabulate them and we are not going to invent it.
We argue that distinction properly in a separate piece on loneliness and solitude, which is not published yet. For the practical half, what to do on the evening when this is the thing in the room, our guide to coping with loneliness is the better page, and so is the one on loneliness after moving to a new city if that is the specific shape of it. If you would rather read something long and good than be advised, there are books about loneliness.
Why there is no trend line here
Because there is one year of data, and one year is not a trend. The loneliness question entered the National Health Interview Survey in January 2024. The CDC’s state-based surveillance item is a different instrument whose wording changed after 2022, so it does not give this question an earlier point, which means the honest answer to whether American loneliness is rising, measured this way, is that we do not yet know.
Other instruments have their own series, and they move. They are different questions and they are not a trend in the same thing. When the 2025 federal file publishes, this page will have a second point, and we will say what it is.
One more measure people reach for in this context is how many Americans live alone. That is a housing statistic. It counts doors, not feelings, and the evidence we hold says that living alone is among the weakest available measures of social connection.
How to cite this page
If you need one defensible sentence about young adults and loneliness in the United States, use a measured one:
In 2024, 6.3% of US adults aged 18 to 29 reported feeling lonely always or usually, against 4.0% of adults aged 65 and over, and 4.9% of all adults. Figures computed by The Digital Hope from the CDC’s National Health Interview Survey 2024 Sample Adult public-use file, weighted, n = 31,470 adults with a valid response.
And if you need the qualification that belongs with it:
Age, gender and national culture together explain about 2% of the variation in loneliness (Barreto et al., 2021, n = 46,054), so population age differences say little about any individual.
Method
- Every figure names its instrument, the population it describes and the date we read it.
- Government figures come from the publishing agency’s own file, not from a summary of it.
- Where a figure is our own calculation, we say so, publish the method, and show the check against the numbers the agency’s other analysts have already published.
- Confidence intervals are printed. A point estimate without one invites more confidence than it earned.
- A claim we cannot trace is named as untraceable rather than repeated or quietly dropped.
- No prevalence is addressed to the reader. A percentage is a property of an instrument and a sample. It is not a property of a person, and we do not write it as though it were.
- No health outcome claims appear on this page. They are a real literature, they are mangled almost everywhere, and a page about how common something is does not need them.
Insight The rule we apply to everything above: cite the meta-analysis, not the body that quoted it. An advisory, a charity report or a press release is a pointer, not a source. Follow the pointer, open the paper, print the interval. We wrote about where this habit came from in our piece on journaling statistics, which is the same exercise run on a different subject.
Questions people ask
Is it normal to feel lonely in your twenties?
On the evidence, it is ordinary. Fewer than half of American adults under thirty say they never feel lonely, which is the lowest of any adult age group.
Are young people really lonelier than older people?
Yes, on the US federal survey and on England’s national survey, and by less than the coverage suggests. The US federal gap between the under-30s and the over-65s is 2.3 percentage points.
Does feeling lonely mean something is wrong with me?
This is often the question underneath searches on this subject, and the data answers it more kindly than the headlines do. Loneliness is defined officially as a gap between the connection a person wants and the connection they have. A gap is a circumstance. The steadiest finding on this page is that nearly six in ten young adults feel this at least rarely, which is not a description of a defect.
Which loneliness statistic should I use?
If you want prevalence in the US population, the National Health Interview Survey figure, because it is a federal probability sample with a published instrument. If you want to know how many people felt it yesterday, Gallup. If you want a scale-based classification, the UCLA-based indices, with their threshold stated so the reader can see where the number comes from.
Where can I get this data myself?
The CDC publishes the file. Search for the NHIS 2024 Sample Adult public-use file, and the variable is LONELY_A, with WTFA_A as the weight. IPUMS carries the same item as LONELYFREQ if you prefer their extracts.
Do loneliness programmes work?
Out of scope for this page and worth one honest line. The standard meta-analysis of fifty studies found a small average effect in the randomised trials, and found that interventions simply creating more opportunities to meet people did not reach significance, a result that rests on only two studies. More company is not reliably the lever, which is consistent with loneliness being a discrepancy rather than a shortage.
The thing a number cannot tell you
What none of this measures is which connection is missing. The surveys can tell us that 6.3 percent of young American adults feel lonely always or usually, and that the figure is the country’s highest, and that a person’s age accounts for almost none of their own answer. They cannot tell anyone which person they have stopped calling, or which room they go quiet in, or what specifically they want that they are not getting. That is the part that would help, and it is the part no instrument has ever reached.
Therapy is one option for finding it, and for many people it is the right one. Writing it down is another. VentSpace is ours, so treat this as what it is: a journaling app that turns what you write into a clear read on your life balance, plus small, doable next steps, which is sometimes enough to name the gap. Prefer to try it on your laptop first? VentSpace Live runs in your browser, free, with nothing to install. It does not fix it, and it is not a person. If what is missing is somebody to call, the page you want is the phone, not this one.
About this article

Written by
Sai Subramaniam
Founder, VentSpace
I write these guides because I have been where you are. I am working through my own hard seasons, and I share the things that actually helped me, so that anyone going through it has a steady companion close by instead of facing it alone. VentSpace is the app I built for exactly that: a journaling app that turns what you write into a clear read on your life balance, plus small, doable next steps toward feeling more like yourself.
This writing is honest and every claim is sourced, and it is not a substitute for professional care. If you are struggling, reaching out to a professional is a strong move, not a failure.
Explore VentSpaceTry VentSpace LiveHow this one was checked. Every factual claim traces to a named source, and the source is printed next to the claim rather than kept in a footnote. Quotes are pinned to the work they come from, with the year, the letter or the chapter where one exists. Where a widely repeated claim could not be traced, it was left out and the omission recorded. Where a figure is contested, both sides are printed.
No affiliate links, no paid placements, and nobody paid to appear here. Where we mention our own app, we say that it is ours, we state its limits, and we never position it as a substitute for care.
Reviewed: October 2026. Prices, platforms and product availability move quickly, and anything we could not verify at the time of writing is marked as unverified rather than turned into a number.
Corrections. If something here is wrong, we would rather know. Corrections are made in place, with a note saying what changed. Updated 15 October 2026: the federal figures are now dated 2024, a line saying the survey was the first federal loneliness question was corrected, a false line about the largest answer group was removed, survey figures we could not trace to a held source were taken out of the comparison table and the trend section, and the description of our own app was corrected.