
The buyer’s journey is the path a company takes from noticing a problem to signing a contract. In B2B, a buying group runs it, and most of it happens before anyone talks to a seller.
That changes what marketing is for. Most B2B deals are decided before the seller is in the room, so the job is to be on the shortlist before the shortlist exists. Sequencing, follow-up speed and a sharper demo all matter, but they act on a decision the buying group has mostly made already.
This page defines the term, shows what the buying research says about who buys, how much they decide alone and where they research, then maps marketing to each stage and walks through how ads, content, outbound and sales hand the account to each other. It is written for people who own a B2B pipeline number, not for a first course in marketing.
How we know
Buyer surveys: 6sense’s 2025 survey of nearly 4,000 B2B buyers (a vendor survey, read through a secondary summary), LinkedIn and Ipsos’s 2025 survey of over 900 buyers (platform-commissioned), and Forrester’s State of Business Buying 2026 (press release, method not stated). Each is labelled where it is used.
Behaviour studies: HBR’s 2011 audit of 2,241 US firms, Clay’s 2026 test of 6,346 demo forms, and one firm’s attribution comparison published by Refine Labs in 2023.
First-party: programmes I ran, labelled where they appear. Each is one account, n=1.
What this cannot tell you: survey answers are what buyers recall and say, not what they did, and several of these publishers sell the fix their survey points to. Read the numbers as direction with a stated source, not as constants.
The short version
A group buys, not a person: Forrester reports around 13 internal stakeholders plus 9 outside influencers on a purchase.
The shortlist forms before contact: in 6sense’s 2025 survey, 94% of buyers had ranked vendors before speaking to one, and 77% bought from the early favourite.
Research runs through AI and peers: buyers use AI answers, then check them with people they trust.
Most of your market is not buying this quarter: that is a heuristic, John Dawes’s 95:5, not a measurement.
Ads, content, outbound and sales are one loop: each stage hands the account to the next, and what closes sharpens the ICP for the next round.
Where the model comes from, and what the research changed
The three-stage model (awareness, consideration, decision) is a planning convention, not a finding. No study defines it, and it describes one person moving in one direction. It is still useful as a content map. It stops being useful as a picture of how a company buys.
Three pieces of research changed the picture, each with a date:
- The “how far before contact” number moved. 6sense’s buyer survey put first seller contact at 69% of the way through the process in earlier editions and at 61% in its 2025 edition, published November 2025.
- The buyer became a group. Forrester’s buying-group research, most recently its State of Business Buying 2026 (21 January 2026), describes purchases with many internal stakeholders and outside influencers, with procurement a decision-maker in 53% of them.
- The in-market share got a rule of thumb. In 2021, writing for LinkedIn’s B2B Institute, Ehrenberg-Bass researcher John Dawes derived that only about 5% of business buyers are in market in a given quarter, from an assumed five-year switching cycle.
None of these is a law of nature. Each is a survey or a derivation with its own population. What they agree on is direction: more people, more research done alone, and a decision that forms early.
My read: keep the stages for planning content, and drop the idea that one person walks through them in order.
Quick Summary: what is the buyer's journey in B2B?
Q: What does buyer’s journey mean in B2B marketing?
A: It is the path a company takes from noticing a problem to signing a contract. In B2B a buying group runs it, and most of the research happens before anyone contacts a seller, which makes the classic three stages a planning tool rather than a description.
Insight: the stages are for you, not for the buyer
The three labels exist so a marketing team can decide what to publish and when. Use them that way and they help. Use them to predict a deal and they mislead, because a buying group can be at three stages at once.
A buying group buys, and its members research separately
A B2B purchase is made by a group whose members research on their own, at different times, with different questions. The finance lead, the end user and procurement are each somewhere different in the “journey” on the same day.
How large that group is depends on who is counting:
- Forrester reports around 13 internal stakeholders plus 9 external influencers on a purchase (State of Business Buying 2026, press release, January 2026, method not stated).
- Dreamdata’s 2026 dataset of 3.5 million B2B customer journeys, mostly software companies, counted about 10 stakeholders per journey. Dreamdata sells attribution and does not publish its model.
- LinkedIn and Ipsos’s 2025 survey of over 900 buyers in seven markets found 40% reporting larger buying committees than before.
The counts disagree, so treat any single number as a description of that study’s sample. The direction is the part that holds: more people, each with a veto.
The seller side has not caught up. In the same LinkedIn survey, 57% of sellers did not start multithreading (contacting several people in the account) until after the first meeting, and top sellers were three times likelier to be connected to eight or more stakeholders per account. That last figure is a correlation from a company that sells Sales Navigator, so it does not show that more connections cause wins.
What this means for you if you sell a considered B2B purchase: your content has to answer different questions for different roles, and your targeting has to reach the account, not one contact. For a single-decision-maker sale under a few thousand dollars, a smaller version of all this applies.
More people means more vetoes.
Quick Summary: how many people are in a B2B buying group?
Q: How many stakeholders are involved in a B2B purchase?
A: It depends on the study. Forrester reports around 13 internal stakeholders plus 9 outside influencers (2026), and Dreamdata counted about 10 per journey in its 2026 data. All the sources agree the group is large and growing.
Insight: procurement is in the room more often than marketing plans for
Forrester’s 2026 release reports procurement as a decision-maker in 53% of purchases, and over 60% of buyers running a trial, rising to 78% for purchases of $10M or more. A page written only for the champion leaves the person who signs the purchase order with nothing to read.
Most of the decision happens before first contact
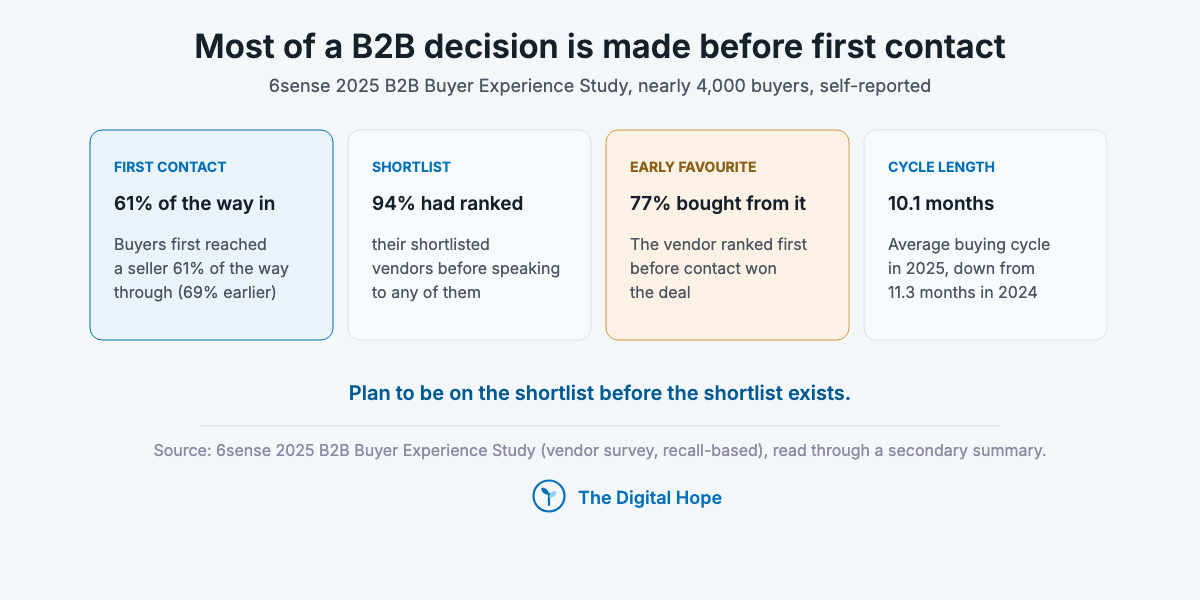
In 6sense’s 2025 buyer survey, buyers first contacted a seller about 61% of the way through their process, 94% had already ranked their shortlisted vendors, and 77% bought from the vendor they ranked first. The survey covered nearly 4,000 buyers (46% North America, 20% continental Europe, 20% UK and Ireland, 14% APAC), half of them VP or above and about half at companies with $10M to $500M revenue.
Two limits before you use it. First, it is a self-reported, recall-based survey by a company that sells software for reaching buyers before they make contact, so it has a stake in the answer. Second, it is read here through a secondary summary because 6sense’s own report page would not open. It is still the largest recent survey with a published respondent mix, which is why it is the one to cite.
What else the pre-contact phase looks like:
- Buyers would rather not talk to sales, and regret it when they don’t. LinkedIn and Ipsos (2025, over 900 buyers) found 75% would prefer to buy without a salesperson, yet those who did report 23% higher purchase regret.
- They want a seller in the middle, not at the start. The same survey found 88% value seller engagement most in the middle of the journey, against 57% early on.
- The cycle is long. 6sense put the average at 10.1 months globally in 2025, down from 11.3 in 2024.
- AI is now a research step. LinkedIn’s survey reports 94% of buyers using AI at some stage, and Forrester reports buyers see AI answer engines as incomplete and check what they find with people they trust.
The practical reading: if your brand is not known to the buying group before it starts ranking vendors, follow-up speed and a better demo act on a decision you were not part of. This holds for B2B purchases with a high ACV and a committee behind them. For urgent, low-cost or single-buyer purchases, the pre-contact phase is shorter and inbound speed matters more.
The shortlist is set early.
Quick Summary: how much research do B2B buyers do before contacting sales?
Q: How far into the buying process do B2B buyers contact a vendor?
A: About 61% of the way through, in 6sense’s 2025 survey of nearly 4,000 buyers, with 94% having ranked vendors before contact and 77% buying from their early favourite. It is a vendor survey based on recall, so read it as direction.
Insight: AI answers widened the research phase without replacing people
Forrester’s 2026 release describes buyers using generative AI to research, then validating the answers with people they trust: colleagues, peers and outside influencers. For marketing that means two jobs at once: be cited where AI answers are assembled, and be named by the people buyers ask afterwards. Our guide to SEO content writing covers the page side of that work.
The dark funnel: much of the influence never reaches your reports
“Dark funnel” is a vendor term for research and influence your tracking cannot see: podcasts, private Slack groups, a colleague’s recommendation, a LinkedIn post read without a click, an AI answer. The idea holds up. The percentages attached to it (“90% happens in the dark”) do not have a published method behind them.
What the one documented comparison shows: Refine Labs published a 12-month comparison for one company (620 declared-intent conversions, $21.5M closed-won ARR, 2023). Buyers credited a podcast for 53% of revenue when asked “how did you hear about us”, while the attribution software credited it with 0%. Recast’s response (31 May 2023) made the opposite point: self-reported answers suffer from recall and recency bias and overweight memorable channels. Both are right. The two methods fail in different directions, which is the reason to run them side by side.
How to see more of it, by what you have:
- A demo or contact form: add a free-text “how did you hear about us” field and read the answers monthly next to your CRM source field.
- A sales team: ask in the first call what the buyer read and who they asked, and log it in the CRM, not in a call note.
- Visitor or account identification: use it to see which accounts are reading, as a prioritisation signal, not as a list to email.
On that last one, one account’s experience. In one B2B account I ran (2026), a visitor-identification tool de-anonymised 1,052 companies and produced many identifications and no useful leads [FIRST-PARTY, n=1]. That is one site and one tool, US visitors only, with match accuracy nobody has tested publicly. Visitor identification tells you who is reading, and that is all it tells you. For EU and UK visitors, the EDPB’s October 2024 guidelines bring tracking scripts and pixels under ePrivacy consent rules, so get legal review before installing it.
Quick Summary: what is the dark funnel in B2B?
Q: What does dark funnel mean in marketing?
A: It is the research and influence your tracking cannot see, such as podcasts, communities, peer recommendations and AI answers. Compare software attribution with “how did you hear about us” answers to see part of it, because each method misses what the other catches.
Insight: the journey runs longer than any attribution window
Dreamdata’s 2026 benchmark, built on 3.5 million B2B journeys, put the average at about 281 days from a first LinkedIn ad impression to revenue, and reported that 81% of the journey happened before the account entered the sales pipeline. Dreamdata sells attribution and does not publish its model, so treat both as direction. A 30-day click window will credit almost none of that.
Most of your market is not buying this quarter
“The 95% figure is not meant to be a precise rule.”
John Dawes, Ehrenberg-Bass Institute, “The 95:5 rule”, johndawes.info
John Dawes’s 95:5 rule says that if companies replace a key supplier about every five years, only around 5% are shopping in any given quarter. It is arithmetic from an assumed cycle, written for LinkedIn’s B2B Institute in 2021, and Dawes calls it a heuristic himself.
The real share depends on your category’s buying cycle:
- Dawes’s own derivation: about 20% of buyers in market per year, about 5% per quarter, for a five-year cycle. Shorter cycles mean more in market.
- Forrester’s counter-estimate (John Arnold, 12 May 2025) put the in-market share for martech nearer 15% to 30% than 5%, from a survey of switching plans, varying by category and by vendor. Stated plans overstate what people do.
- Event-driven categories (a new regulation, a new AI budget) can have far more of the market buying at once.
What the rule justifies: spending some of the budget on being remembered by the accounts that are not buying yet, so they already know you when they enter the market.
What it does not justify: any specific split of the budget. If your category has a short or urgent buying cycle, weight the budget toward capturing demand that already exists.
Build memory before the market opens.
Quick Summary: what is the 95:5 rule in B2B?
Q: Is it true that only 5% of B2B buyers are in market?
A: It is a rule of thumb, not a measurement. John Dawes derived it from an assumed five-year switching cycle and says it is not precise, and Forrester’s 2025 survey put the martech in-market share nearer 15% to 30%. Your category’s buying cycle sets your real number.
Insight: the rule is an argument for reach, not for silence
The 95:5 heuristic is often quoted to justify brand spend, and sometimes to justify cutting performance spend. Dawes’s derivation supports neither on its own. It supports one thing: an account that is out of market today can be in market next year, and the vendors it already knows will be the ones it ranks first.
How marketing maps to each stage of the journey
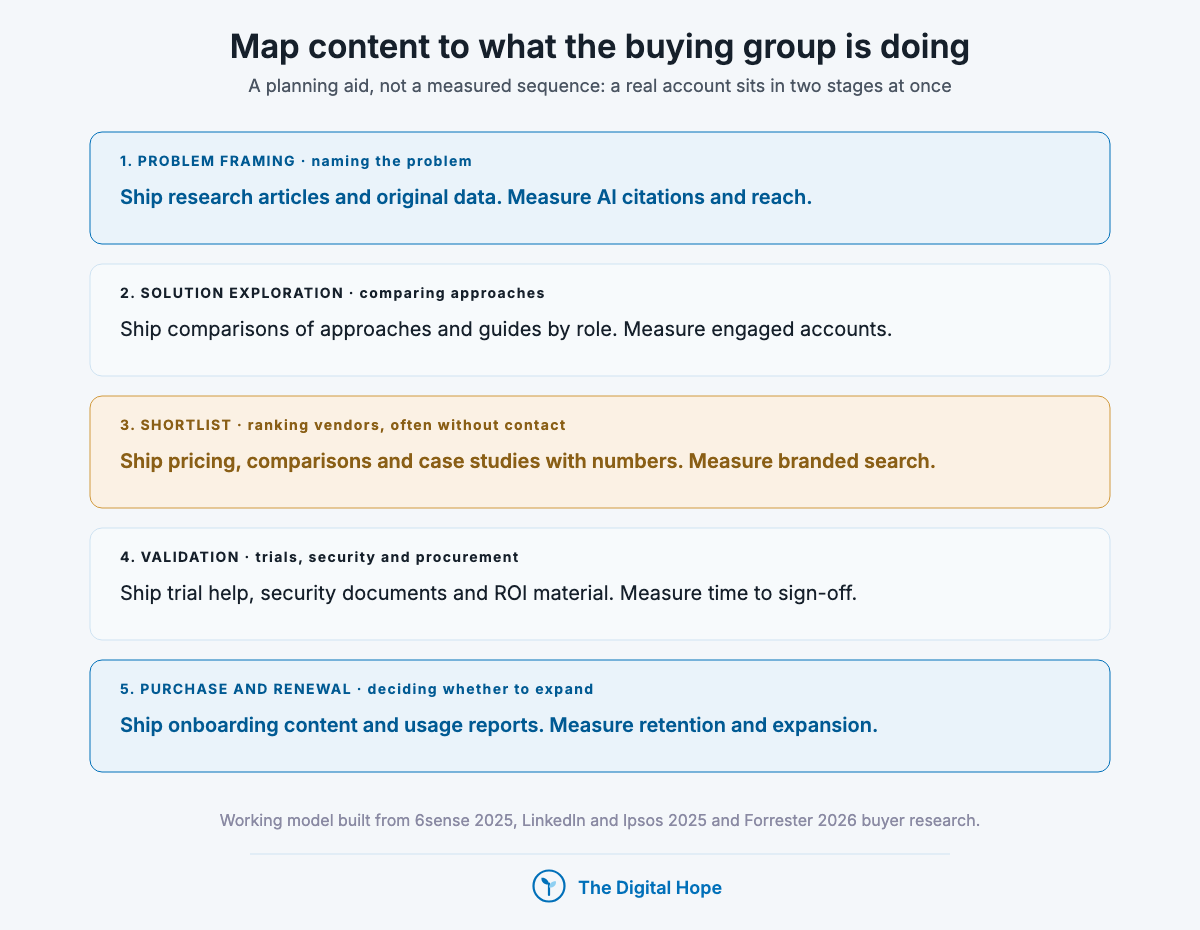
Map content and channels to the questions each member of the buying group asks, not to one buyer’s funnel. The table below is a working model built from the research above. It is a planning aid, so expect a real account to sit in two rows at once.
| Stage | What the buying group is doing | What marketing ships | Where it reaches them | What to measure |
|---|---|---|---|---|
| Problem framing | Naming the problem, sizing the cost of doing nothing | Research-intent articles, original data, point-of-view posts | Search, AI answers, LinkedIn organic, podcasts | Non-branded search impressions, AI citations, reach in the target accounts |
| Solution exploration | Comparing approaches, not vendors yet | Comparisons of approaches, “how it works” pages, guides by role | Search, AI answers, communities, newsletters | Engaged accounts, return visits, self-reported source |
| Shortlist | Ranking vendors, often without contacting any | Comparison pages, pricing, case studies with numbers, reviews | Branded search, review sites, peer recommendations | Branded search volume, pricing-page visits by target account |
| Validation | Trials, references, security and procurement review | Trial setup help, security documentation, ROI material for finance | Sales, email, direct | Trial activation, time to procurement sign-off |
| Purchase and renewal | Contracting, onboarding, deciding whether to expand | Onboarding content, usage reports, customer stories | Product, customer success | Retention, expansion, referrals |
For search, the stage decides the query type and the page type. Problem-framing and solution-exploration queries are informational, which is where the click studies find AI answers take the most clicks, and where search is the cheapest place to show up. Shortlist queries carry provider intent, and that is where paid search earns its cost. Our comparison of SEO vs paid search sets out how to split the budget by query type and buyer.
Every stage needs a version of the page for more than one role. If you sell to a technical buyer and a finance buyer, the same stage needs two pages, or one page with two clearly labelled sections.
Map to questions, not to stages.
Quick Summary: how do you map content to the buyer's journey?
Q: What content works at each stage of the B2B buyer’s journey?
A: Research and point-of-view content for problem framing, comparisons of approaches for exploration, pricing, case studies and comparison pages for the shortlist, and trial, security and ROI material for validation. Write each for the roles in the buying group, not one persona.
Insight: the shortlist stage is where most B2B sites are thinnest
6sense’s 2025 survey found buyers ranked vendors before contact in 94% of cases. The pages that decide that ranking are pricing, comparisons, case studies with numbers and security documentation. If your site gates or leaves them out to force a sales conversation, the buyer ranks you on what your competitors publish instead.
Ads, content, outbound and sales are one loop
Ads warm the accounts, account interest hands off to outbound, sales converts, and what converts sharpens the ICP, which then sharpens targeting and messaging for the next round. That is the loop. Treat the four as separate teams with separate targets and each one chases a number the next one cannot use.
Here’s the reason. In many B2B categories, bottom-of-funnel commercial terms have little search volume, and buying only those terms skips the stage where a buying group decides who it trusts. An account that only buys provider-intent clicks starves, because by the time the buyer searches for a provider, the shortlist is set.
What the loop looks like when each part feeds the next:
- Top of funnel: video, thought leadership and research content reach the accounts that are not buying yet.
- Middle: retargeting and conversion data from the top feed the middle, so the accounts that engaged see proof, comparisons and case studies.
- Bottom: content downloads and high-intent visits feed bottom-of-funnel offers and outbound, so a salesperson contacts an account that already knows the name.
- And in one B2B account I ran (Clarifai, an AI infrastructure company, Jul 2025 to May 2026), rebuilding an account that had chased only bottom-of-funnel terms into a full funnel took cost per signup from about $1,000 to under $4, with sales-accepted leads at about $25 to $30 [FIRST-PARTY, n=1]. That was one company with product-market fit, and I would not expect the same funnel to rescue a product nobody wants.
On a small budget, the loop shrinks but keeps its shape: provider-intent search plus retargeting is the floor, and organic content does the top-of-funnel work. Our performance marketing fundamentals cover how a campaign is built at each level.
One loop, not four teams.
Quick Summary: how do marketing and sales work together across the buyer's journey?
Q: How should ads, content, outbound and sales hand off in B2B?
A: As one loop: ads and content warm accounts, account interest hands off to outbound, sales converts, and closed deals sharpen the ICP and the targeting. Bottom-of-funnel ads alone starve in B2B because the shortlist forms before the buyer searches for a provider.
Insight: product-market fit decides more than the funnel design
My read, from running the same campaign types for more than one company: no handoff design fixes a product the buying group does not want, and a loop that keeps sharpening the ICP is often how a team finds that out early.
The handoffs, step by step
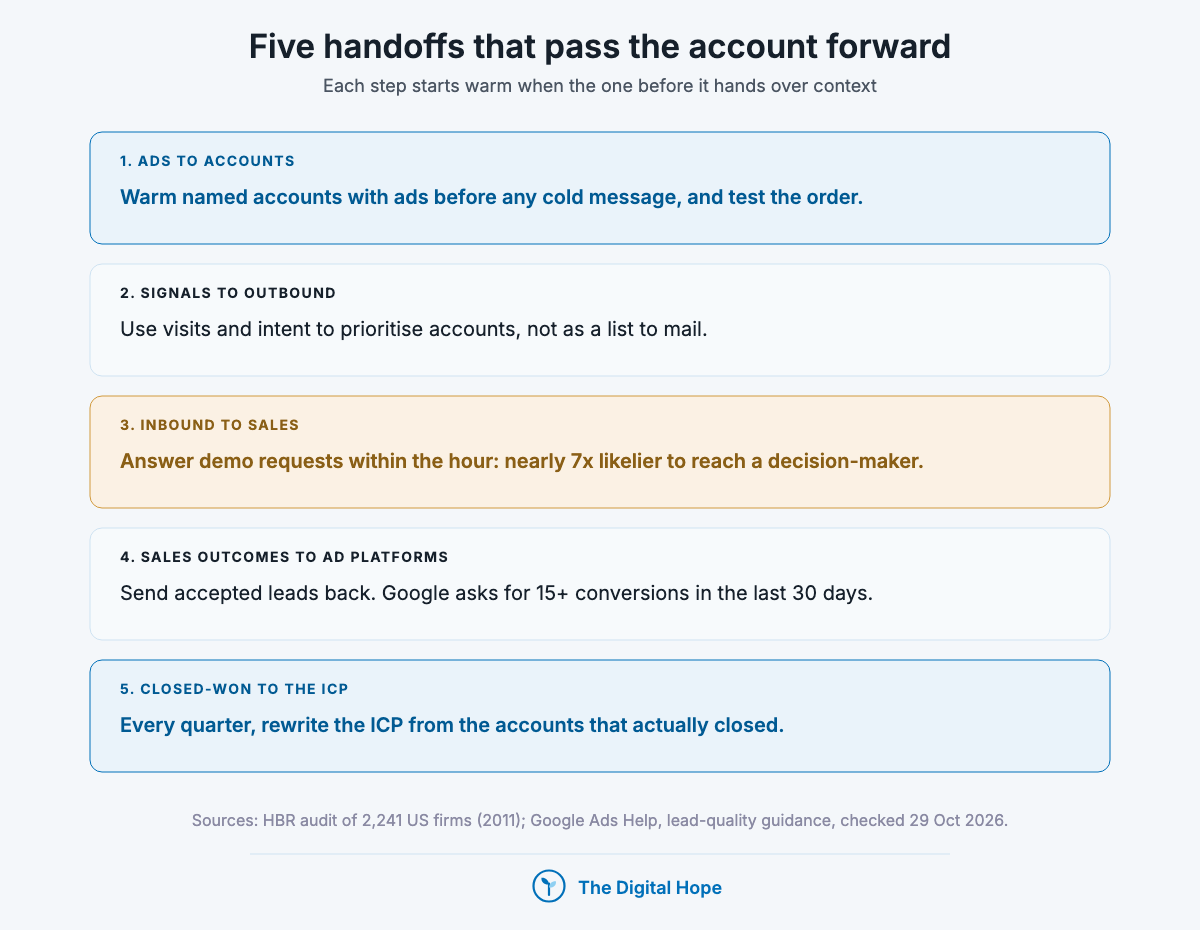
Each handoff has one job: pass the account forward with enough context that the next step starts warm. These are the five that break most often.
1. Ads to accounts: warm before you reach out
Run ads to the named accounts before anyone sends a cold message, and treat the order as a hypothesis to test. Buyers favour vendors they already know (6sense 2025, LinkedIn and Ipsos 2025), which supports the direction. No study with a control group we found measures how much warming lifts replies, so the “2x” and “25 to 40%” figures in circulation are claims, not findings.
In one programme I run (Forage AI, 2026), nobody gets a cold email until they have seen us at least three times: LinkedIn ads first, then retargeting and engagement, then outreach. Across 250 healthcare reseller accounts with deals of $150K and up, click-through rates reached up to 10% [FIRST-PARTY, n=1]. That is engagement, not pipeline. Meetings and pipeline from the programme are not measured yet, and with no holdout it cannot show warm beats cold.
Skip this step only when your deal size is low and your market is large enough that cold volume pays on its own.
2. Signals to outbound: prioritise, then personalise on relevance
Use engagement, visits and intent as a reason to contact an account sooner, not as a list to mail. Third-party intent shows an account reading more than usual about a topic. It does not show who is ready to buy, and no intent vendor publishes its precision. First-party signals rank above third-party ones: your own site visits, your product sign-ups, your review-site category pages.
The message matters more than the volume. LinkedIn and Ipsos (2025) found three-quarters of sellers agree that high-volume, untargeted outreach erodes trust. Write to the role’s problem, not to the fact that someone visited your pricing page, because quoting a visit back to a buyer tells them they were tracked.
3. Inbound to sales: answer a demo request within the hour
A demo request is the buying group raising its hand, so a person should answer it within the hour. A 2011 HBR study of 2,241 US firms found those that responded within an hour were nearly 7 times likelier to reach a decision-maker than those responding an hour later. The measure was a qualifying conversation, not a sale, and the data is 15 years old.
Most companies are still slower than that. When Clay requested demos from 6,346 companies in 100 countries in 2026, 32% replied by email at all, about 7% started a conversation with a salesperson, and the average reply took 15 to 24 hours. Clay used one synthetic identity, so some of the silence may have been reasonable triage.
Hold this standard for demo and contact requests. A content download with no buying signal is a different event and goes to nurture.
4. Sales outcomes back to the ad platforms
“leads are selected as your optimization goal by default”
LinkedIn Help, “Lead generation ad objective”, on campaigns without a Conversions API integration, checked 29 October 2026
Send the stage your sales team accepts back to the ad platforms, or they keep buying form fills. Without qualified-lead data, a LinkedIn Lead Gen campaign bids for any lead. Its qualified-lead goal needs that data from the LinkedIn Conversions API, a partner or a manual upload, and it then allows only maximum delivery bidding (LinkedIn Help, checked 29 October 2026).
Google Ads has the same logic with a volume floor. Its lead-quality guidance asks for a conversion action with at least 15 conversions in the last 30 days, ideally landing within about 7 days of the click (Google Ads Help, checked 29 October 2026). If your CRM uploads conversions to Google Ads by API, check that the integration moved to the Data Manager API, because Google’s page on enhanced conversions for leads says the old API route was blocked from 15 June 2026.
If you close only a few deals a month, bid on the furthest-down stage that still clears the platform’s floor, such as sales-accepted leads, and reconcile every platform cost per lead with the CRM before you trust it.
5. Closed-won back to the ICP
Every quarter, compare the accounts that closed with the accounts you targeted, and rewrite the ICP from the difference. Titles, company size, industry, the first channel the buyer remembers and the question that started the conversation all belong in that review. If you close only a handful of deals a quarter, run the review twice a year instead, so each pass has enough closed accounts to compare.
A sharper ICP improves targeting and messaging at the same time, which improves every handoff above it. It is the step that makes the loop a loop.
The loop closes in the CRM.
Quick Summary: what are the handoffs between marketing and sales in B2B?
Q: How do you hand off leads from marketing to sales?
A: Warm named accounts with ads, use signals to prioritise outbound, answer demo requests within the hour, send accepted-lead data back to the ad platforms, and rewrite the ICP from closed-won every quarter. Measure each step on accepted opportunities, not on lead volume.
Insight: define every stage by who accepts it
A lead stage is only useful when it says who accepts it and on what evidence: marketing-qualified, sales-accepted and sales-qualified, each signed off by the team that receives it. Forrester analyst Terry Flaherty argued in April 2023 for moving measurement to opportunities and buying groups rather than single-contact lead scores, which fits a purchase made by a dozen people.
Where the buyer’s journey stops being useful
The model stops being useful when it is treated as one person moving forward in order. Three conditions where that breaks:
- When a buying group is involved. Different members sit at different stages on the same day, so “which stage is this account in” has no single answer.
- When you use it to attribute revenue. Stages are not observable events. The attribution comparison above shows that even the channel a buyer came from is disputed, let alone the stage.
- When the purchase is small, urgent or bought by one person. A $50 a month tool bought on a card in one afternoon has a journey too short for a stage map to add much.
It stays useful as a content plan. Mapping questions to stages tells you which pages are missing, especially at the shortlist stage.
Use it to plan, not to predict.
Quick Summary: what are the limits of the buyer's journey model?
Q: Is the buyer’s journey model still relevant?
A: Yes as a content planning tool, no as a description of how a company buys. Buying groups sit at several stages at once, stages cannot be measured directly, and short, low-cost purchases barely have stages.
Insight: a model is a description, not an explanation
Naming the stages does not tell you why an account bought. The “how did you hear about us” answers, the first-call notes and the closed-won review do. The stage map tells you where to look.
What stopped being true
| What | When it changed | Primary source |
|---|---|---|
| “Buyers are 57% or 70% of the way through before contacting sales” as the current figure | 6sense’s 2025 survey put first contact at 61% (69% in earlier editions) | 6sense 2025 B2B Buyer Experience Study, published Nov 2025 |
| “A buying committee of 6 to 10 people” as a fixed size | Forrester reports around 13 internal stakeholders plus 9 external influencers | Forrester, State of Business Buying 2026, 21 Jan 2026 (press release) |
| The journey as one buyer moving through awareness, consideration and decision | Committee buying, pre-contact shortlists and AI answers as a research step | 6sense 2025, LinkedIn and Ipsos 2025, Forrester 2026 |
| MQL volume as marketing’s success metric | Analysts moved measurement toward opportunities and buying groups | Forrester (Terry Flaherty), 5 Apr 2023 |
| Free Clearbit Reveal and the Weekly Visitor Report for seeing which companies visit | Free tools retired; capability moved inside HubSpot | Clearbit changelog, retired 30 Apr 2025 |
| Offline conversion uploads to Google Ads through the Google Ads API | Moved to the Data Manager API | Google Ads Help, enhanced conversions for leads, from 15 Jun 2026 |
Frequently asked questions
What are the stages of the buyer’s journey?
The usual three are awareness, consideration and decision. For B2B planning, a five-stage version works better: problem framing, solution exploration, shortlist, validation, and purchase and renewal. Each is a planning label, not a measured event.
Are B2B buyers 70% of the way through before they contact sales?
No, that figure is out of date. 6sense’s 2025 survey of nearly 4,000 buyers put first contact at about 61% of the way through, and the older 57% and 70% figures came from earlier studies. All of them are self-reported surveys, so read the number as direction.
What is the difference between the buyer’s journey and the sales funnel?
The journey is the buyer’s process. The funnel is the seller’s record of it. The funnel only starts when an account becomes visible to you, which, by the survey evidence above, is often more than halfway through the buyer’s process.
How does AI change the B2B buyer’s journey?
It adds a research step where buyers ask AI tools to frame the problem and compare options. LinkedIn and Ipsos (2025) report 94% of buyers using AI at some stage, and Forrester (2026) reports they check AI answers with people they trust. Being cited in AI answers and being recommended by peers are now two parts of the same job.
Should marketing still use MQLs?
As an operational trigger, yes. As the success metric, no. Define each stage by who accepts it, and measure marketing on sales-accepted opportunities and pipeline, agreed with sales.
Two things to take from this
The decision forms before contact, inside a group, over months. In 6sense’s 2025 survey, 94% of buyers ranked vendors before speaking to one, so plan for being known in the problem-framing and shortlist stages, and expect that work to show up in pipeline two or three quarters later, not in the next month’s report.
This holds for considered B2B purchases bought by a group. For small, urgent or single-buyer purchases, the journey is short enough that capturing existing demand and answering fast matter more than any stage map. A primary study with a published method showing pre-contact shortlisting weakening, or AI agents running the research end to end, is what would change this picture.
About this article

Written by
Sai Subramaniam
SEO, GEO and Paid Ads Manager · 8+ years in growth marketing
I have run SEO, paid media and ABM for B2B AI companies, consumer apps and live-entertainment brands, from a solo operator at an AI infrastructure company to a team of 20 recovering a million-visitor site after a Google update. I write these guides from that work, and every number in them carries its source.
See my portfolioConnect on LinkedInHow this one was checked. Every number traces to a named source with its dataset and period, and every platform feature, policy or limit cites the platform’s own documentation with the date it was verified. Where the author’s own results appear, they are labelled as one account’s results, with the budget and context, not as a rule.
No affiliate links and no paid placements. Tools are named because they are what practitioners use, not because anyone paid to appear here.
Reviewed: October 2026. Ad platforms and search features change every few months; anything we could not verify at the time of writing is marked as unverified rather than turned into a number.
Corrections. If something here is wrong or has changed since, we would rather know. Corrections are made in place, with a note saying what changed.